Profiling
Profiling is the process of analyzing an app's performance, resource usage, and behavior to identify potential bottlenecks or inefficiencies. It's worth making use of profiling tools to ensure your app works smoothly across different devices and conditions.
For iOS, Instruments is an invaluable tool, and on Android you should learn to use the Android Studio Profiler.
But first, make sure that Development Mode is OFF!.
Profiling Android UI Performance with System Tracing
Systrace is deprecated as of React Native 0.82. For modern Android profiling, use Android Studio Profiler instead.
Android supports 10k+ different phones and is generalized to support software rendering: the framework architecture and need to generalize across many hardware targets unfortunately means you get less for free relative to iOS. But sometimes, there are things you can improve -- and many times it's not native code's fault at all!
The first step for debugging this jank is to answer the fundamental question of where your time is being spent during each 16ms frame. For that, we'll be using the built-in System Tracing profiler in the Android Studio.
1. Collecting a trace
First, connect a device that exhibits the stuttering you want to investigate to your computer via USB. Open your project's android folder in Android Studio, select your device in the top right pane, and run your project as profileable.
When your app is built as profileable and is running on the device, get your app to the point right before the navigation/animation you want to profile and start the "Capture System Activities" task in the Android Studio Profiler pane.
Once the trace starts collecting, perform the animation or interaction you care about. Then press "Stop recording". You can now inspect the trace directly in the Android Studio. Alternatively, you can select it in the "Past Recordings" pane, press "Export recording", and open it in a tool like Perfetto.
2. Reading the trace
After opening the trace in Android Studio Profiler, you should see something like this:
Use the WASD keys to strafe and zoom.
The exact UI might be different but the instructions below will apply regardless of the tool you're using.
Check this option in Android Studio Profiler to highlight the 16ms frame boundaries:
![]()
You should see zebra stripes as in the screenshot above. If you don't, try profiling on a different device: Samsung has been known to have issues displaying vsyncs while the Nexus series is generally pretty reliable.
3. Find your process
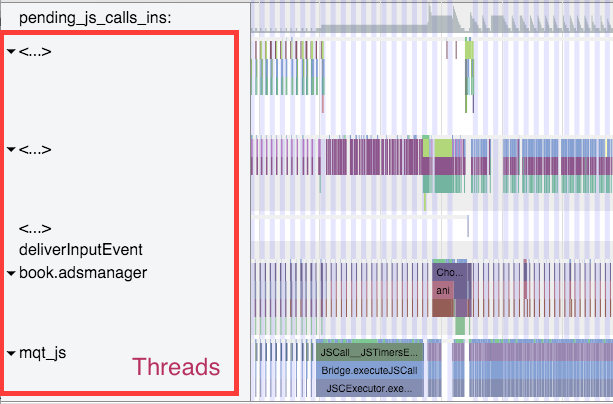
Scroll until you see (part of) the name of your package. In this case, I was profiling com.facebook.adsmanager, which shows up as book.adsmanager because of silly thread name limits in the kernel.
On the left side, you'll see a set of threads which correspond to the timeline rows on the right. There are a few threads we care about for our purposes: the UI thread (which has your package name or the name UI Thread), mqt_js, and mqt_native_modules. If you're running on Android 5+, we also care about the Render Thread.
-
UI Thread. This is where standard android measure/layout/draw happens. The thread name on the right will be your package name or UI Thread. The events that you see on this thread should look something like this and have to do with
Choreographer,traversals, andDispatchUI:
-
JS Thread. This is where JavaScript is executed. The thread name will be either
mqt_jsor similar. To identify it, look for JavaScript execution patterns:
-
Native Modules Thread. This is where native module calls (e.g. the
UIManager) are executed. Look for native bridge communication patterns:
-
Bonus: Render Thread. If you're using Android L (5.0) and up, you will also have a render thread in your application. This thread generates the actual OpenGL commands used to draw your UI. Look for GPU-related activities:

Identifying a culprit
A smooth animation should look something like the following:
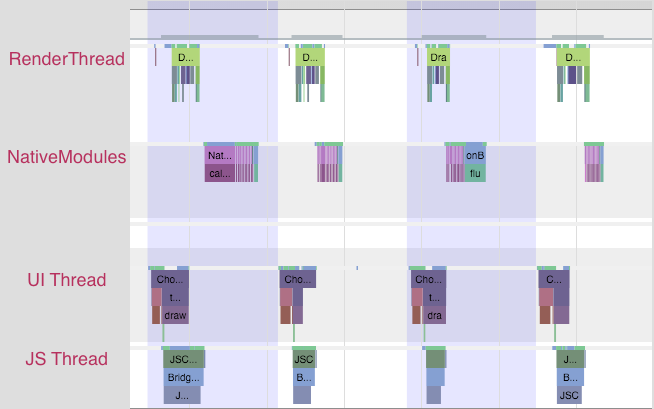
Each change in color is a frame -- remember that in order to display a frame, all our UI work needs to be done by the end of that 16ms period. Notice that no thread is working close to the frame boundary. An application rendering like this is rendering at 60 FPS.
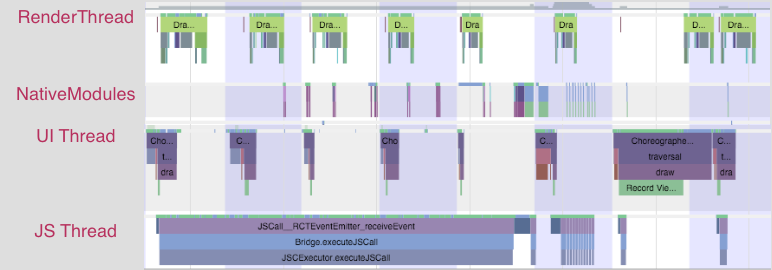
If you noticed chop, however, you might see something like this:
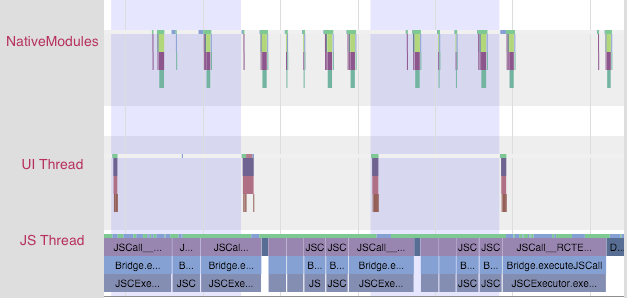
Notice that the JS thread is executing almost all the time, and across frame boundaries! This app is not rendering at 60 FPS. In this case, the problem lies in JS.
You might also see something like this:
In this case, the UI and render threads are the ones that have work crossing frame boundaries. The UI that we're trying to render on each frame is requiring too much work to be done. In this case, the problem lies in the native views being rendered.
At this point, you'll have some very helpful information to inform your next steps.
Resolving JavaScript issues
If you identified a JS problem, look for clues in the specific JS that you're executing. In the scenario above, we see RCTEventEmitter being called multiple times per frame. Here's a zoom-in of the JS thread from the trace above:
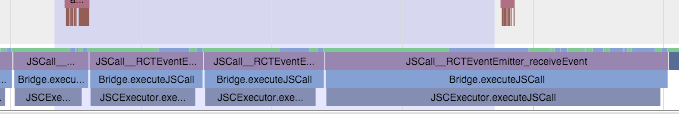
This doesn't seem right. Why is it being called so often? Are they actually different events? The answers to these questions will probably depend on your product code. And many times, you'll want to look into shouldComponentUpdate.
Resolving native UI Issues
If you identified a native UI problem, there are usually two scenarios:
- the UI you're trying to draw each frame involves too much work on the GPU, or
- You're constructing new UI during the animation/interaction (e.g. loading in new content during a scroll).
Too much GPU work
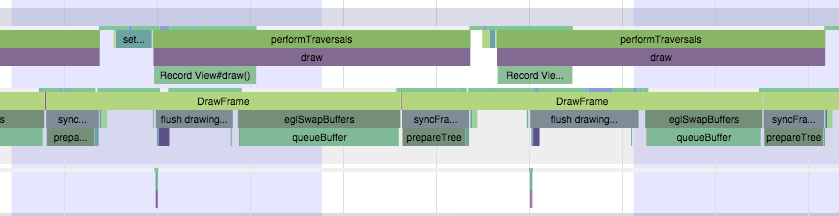
In the first scenario, you'll see a trace that has the UI thread and/or Render Thread looking like this:
Notice the long amount of time spent in DrawFrame that crosses frame boundaries. This is time spent waiting for the GPU to drain its command buffer from the previous frame.
To mitigate this, you should:
- investigate using
renderToHardwareTextureAndroidfor complex, static content that is being animated/transformed (e.g. theNavigatorslide/alpha animations) - make sure that you are not using
needsOffscreenAlphaCompositing, which is disabled by default, as it greatly increases the per-frame load on the GPU in most cases.
Creating new views on the UI thread
In the second scenario, you'll see something more like this:
Notice that first the JS thread thinks for a bit, then you see some work done on the native modules thread, followed by an expensive traversal on the UI thread.
There isn't a quick way to mitigate this unless you're able to postpone creating new UI until after the interaction, or you are able to simplify the UI you're creating. The react native team is working on an infrastructure level solution for this that will allow new UI to be created and configured off the main thread, allowing the interaction to continue smoothly.
Finding native CPU hotspots
If the problem seems to be on the native side, you can use the CPU hotspot profiler to get more details on what's happening. Open the Android Studio Profiler panel and select "Find CPU Hotspots (Java/Kotlin Method Recording)".
Make sure you select "Find CPU Hotspots (Java/Kotlin Recording)" rather than "Find CPU Hotspots (Callstack Sample)". They have similar icons but do different things.
Perform the interactions and press "Stop recording". Recording is resource-intensive, so keep the interaction short. You can then either inspect the resulting trace in the Android Studio or export it and open it in an online tool like Firefox Profiler.
Unlike System Trace, CPU hotspot profiling is slow so it won't give you accurate measurements. However, it should give you an idea of what native methods are being called, and where the time is being spent proportionally during each frame.
Chrome DevTools
Chrome DevTools provides powerful profiling capabilities for JavaScript performance analysis in React Native apps.
Setup
- Enable Chrome DevTools in your React Native app by shaking the device and selecting "Debug"
- This opens a Chrome tab with DevTools connected to your app
Performance Profiling
- Open the Performance tab in DevTools
- Click the record button and perform the actions you want to profile
- Stop recording to analyze the performance trace
Key Features
- CPU Profiling: Identify JavaScript functions consuming CPU time
- Memory Profiling: Track memory usage and detect leaks
- Network Monitoring: Analyze network requests
- Timeline Analysis: Visualize main thread activity
React DevTools
React DevTools is specifically designed for debugging React applications and provides insights into component performance.
Installation
npm install -g react-devtools
Usage
- Start React DevTools:
react-devtools
- In your React Native app, enable debugging mode
- React DevTools will automatically connect
Profiling Features
- Component Profiler: Measure render times and identify slow components
- Flame Graph: Visualize component render hierarchy
- Interactions Tracking: Monitor user interactions and their impact
- Component Inspection: Examine component props, state, and hooks
iOS Instruments
Instruments is Apple's powerful profiling tool for iOS applications, providing deep system-level insights.
Launching Instruments
- Open Xcode
- Go to Xcode > Open Developer Tool > Instruments
- Choose your profiling template
Key Instruments for React Native
- Time Profiler: Identify CPU bottlenecks
- Allocations: Track memory usage
- Core Animation: Monitor UI performance
- Network: Analyze network activity
- Energy Log: Monitor battery usage
Profiling Workflow
- Select your iOS device and app
- Choose appropriate instruments
- Start recording
- Perform the actions to profile
- Analyze the collected data
Migration from Systrace
If you're migrating from Systrace to modern profiling tools:
For Android:
- Replace Systrace with Android Studio Profiler for system-level tracing
- Use Flipper for comprehensive app debugging and profiling
- Combine with Chrome DevTools for JavaScript performance analysis
For iOS:
- Continue using Instruments for system profiling
- Add Flipper for enhanced debugging capabilities
- Use React DevTools for component-level performance insights
Best Practices:
- Use platform-specific tools for native performance issues
- Combine multiple tools for comprehensive analysis
- Profile on actual devices rather than simulators
- Test under realistic conditions and data loads
- Monitor both development and production builds